The VitalIntegrity Dashboard
The VitalIntegrity Dashboard provides key metrics that your organization can use for process improvements and data analysis.
Open the dashboard by selecting the Dashboard tab. Hover over information icons on the dashboard to see metric descriptions. The data automatically refreshes periodically throughout the day.

The dashboard has two tabs, Data Overview and Value. You can print or produce a PDF for each tab by clicking Print in the upper-right corner of the tab. Details about tab metrics are below.
Data overview tab
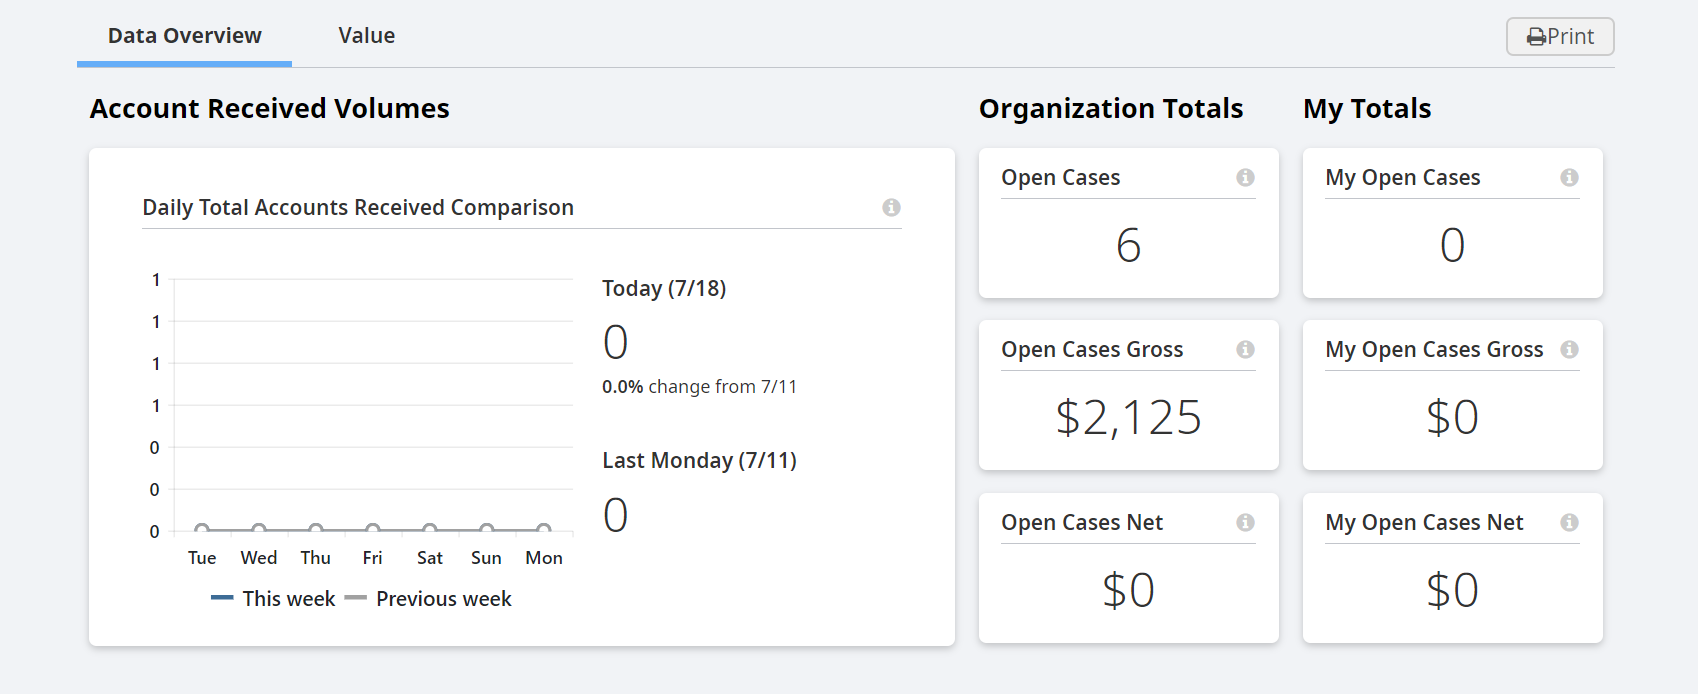
Daily Accounts Received Comparison Graph - Compares daily totals for accounts Vitalware received from your organization in the last two weeks.
- Today (mm/dd) - Daily total accounts received on the current date
- (##) % change from (mm/dd) - Percentage of increase or decrease between current date total and the same day last week total
- Last (day of week)- Daily total accounts received 7 days ago
- This week - Reflects data for current date and previous 6 days
- Previous week - Reflects data for previous days 8 - 14
Organization Totals Tiles - Your organization's total for currently open (Queued, In Process, or Researching workflow status) cases, estimated gross revenue for the open cases, and estimated net revenue for the open cases.
My Totals Tiles - Your assigned case total for currently open (Queued, In Process, or Researching workflow status) cases, estimated gross revenue for your open cases, and estimated net revenue for your open cases.
Value tab
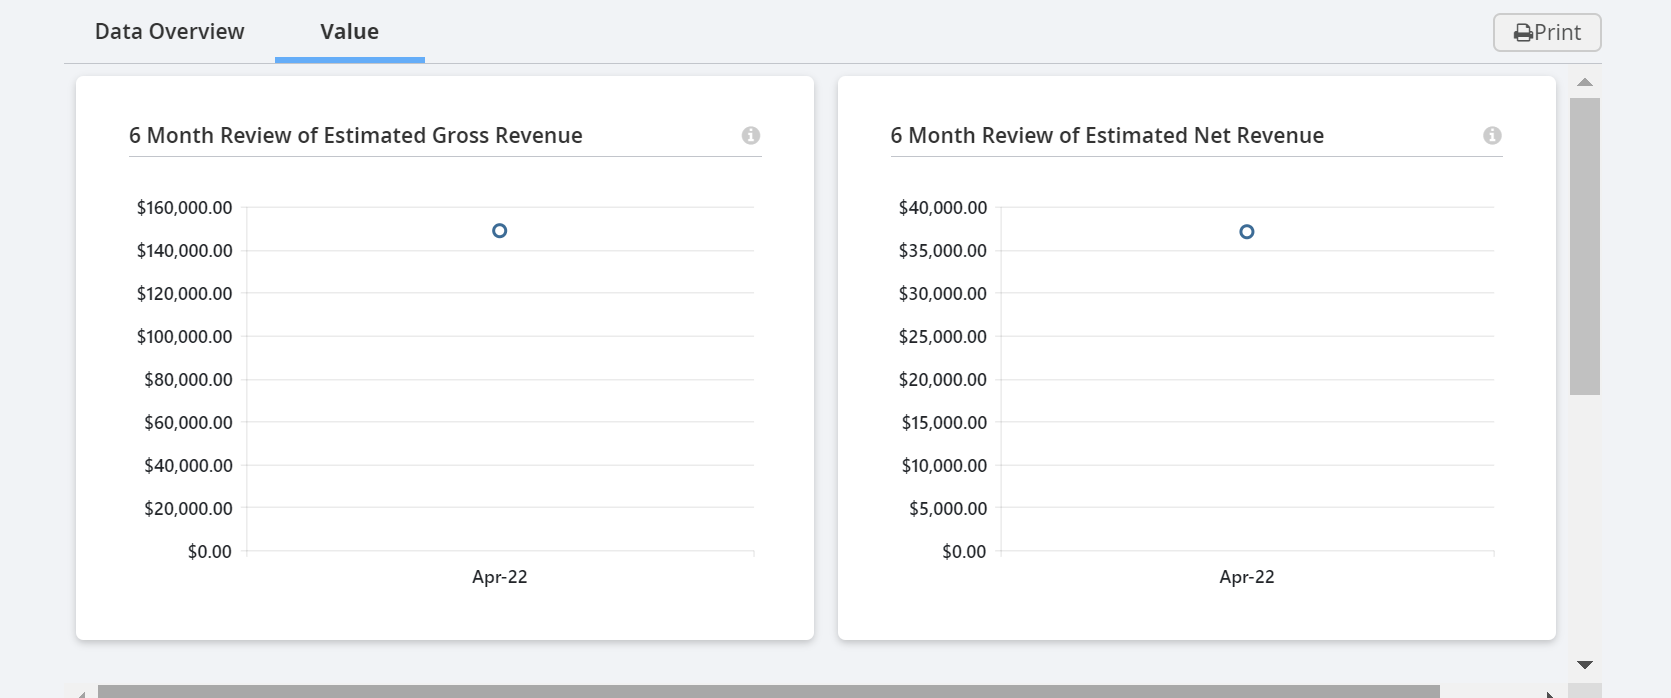
6 Month Review of Estimated Gross Revenue Graph - Estimated gross revenue by month for 6 months of cases (current month and last 5 months, calculation omits Vendor Excluded status cases).
6 Month Review of Estimated Net Revenue Graph - Estimated net revenue by month for 6 months of cases (current month and last five months, calculation omits Vendor Excluded status cases).
Case Metrics by Status Group Tiles - The current total number of Billable, Completed, Excluded, Monitored, and Queued cases. The total includes only cases created in the last 30 days. Click on a tile to see the corresponding data in the Top 10 Rules table or chart view below.
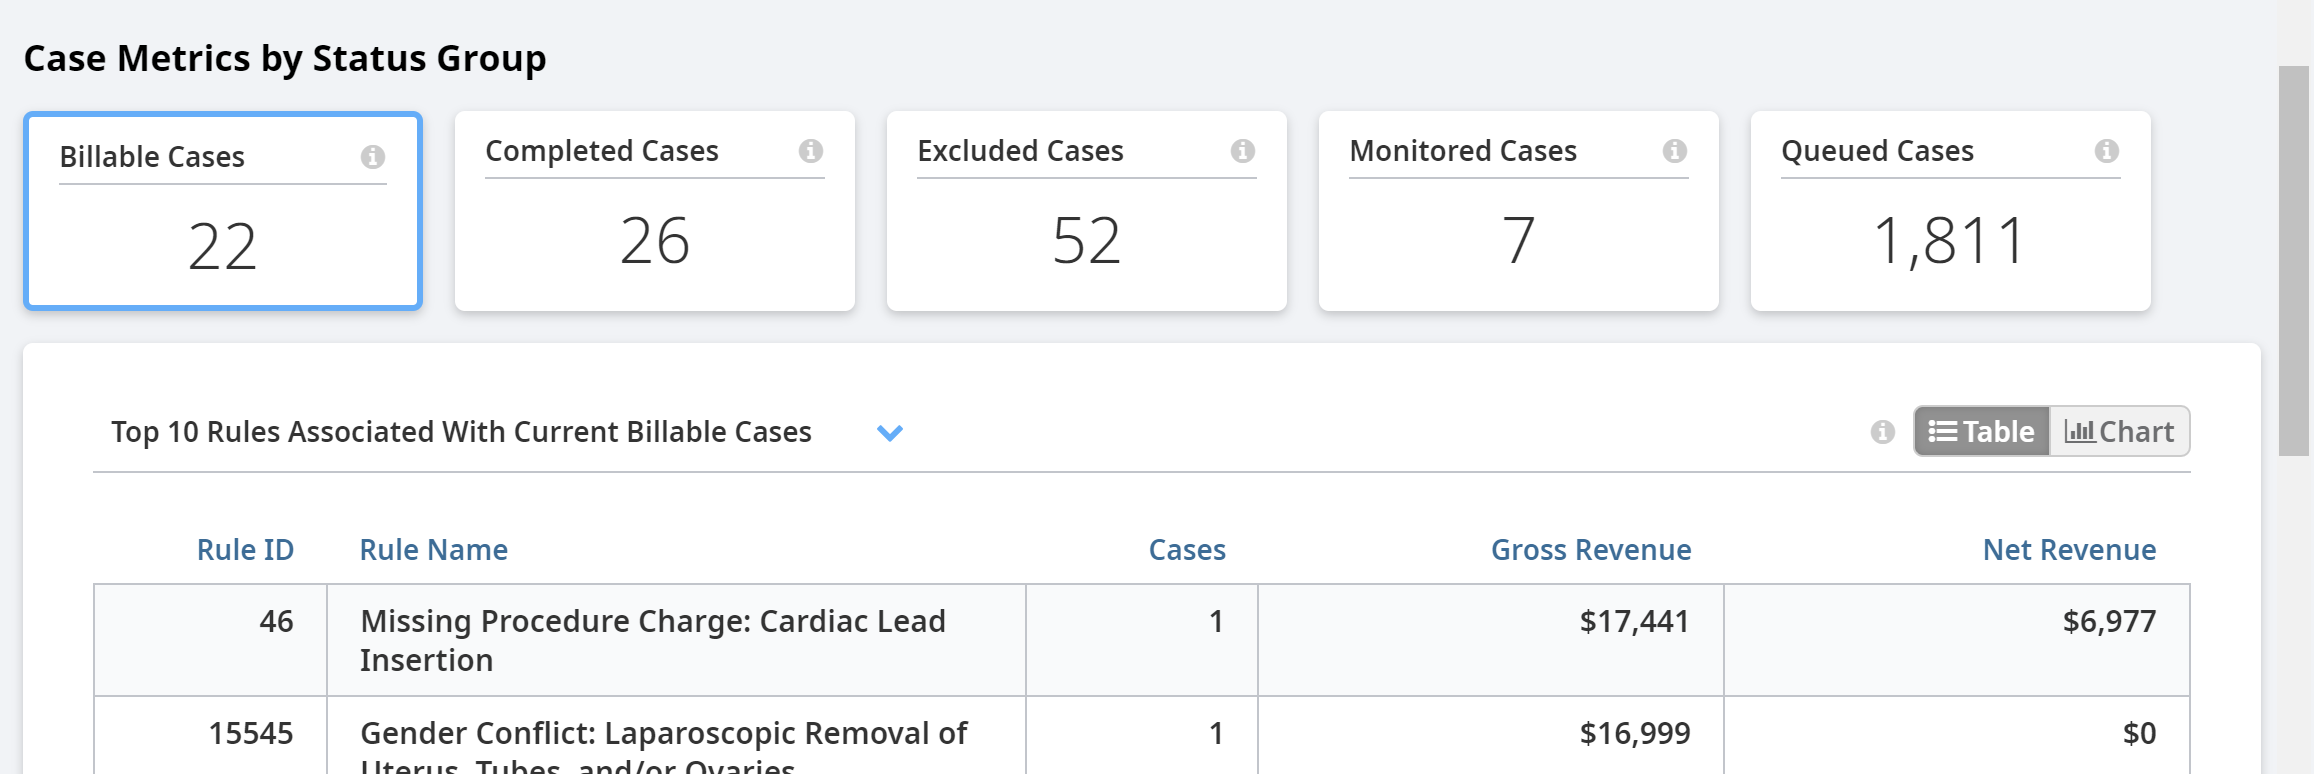
Top 10 Rules Table - Top 10 rules that created cases for a Case Type (workflow status group) within the last 30 days. Select a case type from the header dropdown list to alter the table data. Hover over the Information icon on the right to display its description after selecting a case type. Choices are:
- Top 10 Rules Associated With Current Billable Cases - Top ten rules that created the current Billable cases (workflow status Audit Complete, Rebilled, or Resolved) in the last 30 days.
- Top 10 Rules Associated With Current Completed Cases - Top ten rules that created the current Completed cases (workflow status Audit Complete* - Billable, Audit Complete - Not Billable, Exported, Rebilled, or Resolved) in the last 30 days.
- Top 10 Rules Associated With Current Excluded Cases - Top ten rules that created the current Excluded cases (workflow status Below Threshold, Past Filing Deadline, Past Review Deadline, or Vendor Excluded) in the last 30 days.
- Top 10 Rules Associated With Current Monitored Cases - Top ten rules that created the current Monitored cases (workflow status Monitoring or Rebilling Opportunity) in the last 30 days.
- Top 10 Rules Associated With Current Queued Cases - Top ten rules that created the current Queued cases (workflow status Queued, In Process, or Researching) in the last 30 days.
Note
The Top 10 Rules table and chart are default sorted by Gross Revenue
You can view the Top 10 Rules data in the table view or chart view by selecting the appropriate button on the right side of the title bar.