Change History Dashboard
The Change History dashboard allows you to view a breakdown of the type of changes and the volume of changes across the entities and CDM files you have access to.
Note
The Change History dashboard is available to all user roles, but an administrator must approve and turn on the module for each user. Reach out to your VitalCDM contact for more information, if needed.
View the change history details
The Change History dashboard allows you to view a CDM file’s change history as far back as two years ago from the previous day’s date. When you access the Change History dashboard, the Results table defaults to displaying the change history details for the Entity your user is built in.
You are required to select at least an option for the Start Date, End Date, and Entity filters to further populate results on the Results table. The Start Date and End Date filters default to the first of the current month to the previous day’s date.
View the change history details for an entity
Do the following to view the change history details for an Entity:
Enter the Start Date for the date range.
Enter the End Date for the date range.
Select the Entity. The Results table on the Change History dashboard displays all the Entity’s CDM files that had changes made during date range you entered.
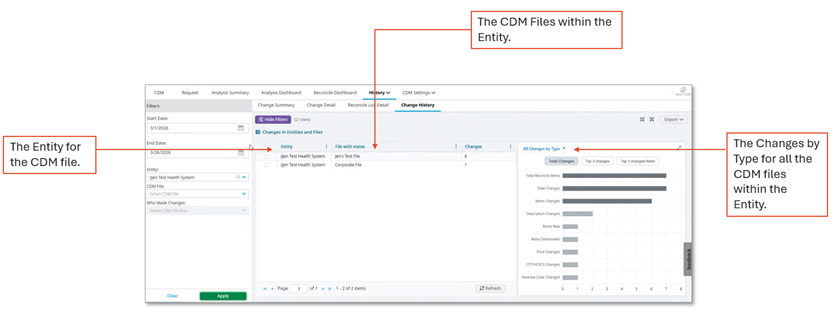 An example of the Results table when you filter to view the changes for an Entity.
View the change history details for an individual CDM file
Note
Selecting an individual CDM file to view the change history details for is optional. You are required to select at least an option for the Start Date, End Date, and Entity filters to populate results on the Results table, if you want to view the change history details for entity other than the default entity (based on the entity your user is built in) that is available when you access the Change History Dashboard.
Select an individual CDM file to view the change history details for on the Filters pane
Do the following to select an individual CDM file to view the change history details for on the Filters pane:
Enter the Start Date for the date range.
Enter the End Date for the date range.
Select the Entity.
Select the CDM File.
Do one of the following:
- Select the Cost Center, if it is a cost-center based file.
- Select the Department, if it is a department based file.
Note
The ability to select an option from the Who Made Changes dropdown is only available when you select a CDM File. This filter is only available for you to see who made changes on individual files, not for who made changes across multiple files.
Select a user from the Who Made Changes dropdown, if needed.
Click Apply. The Results table on the Change History dashboard displays the changes made to the individual CDM file you selected during the data range you entered.
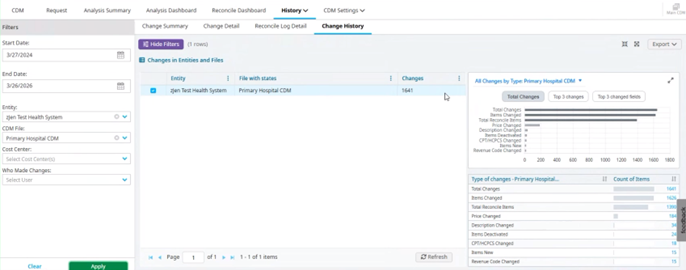
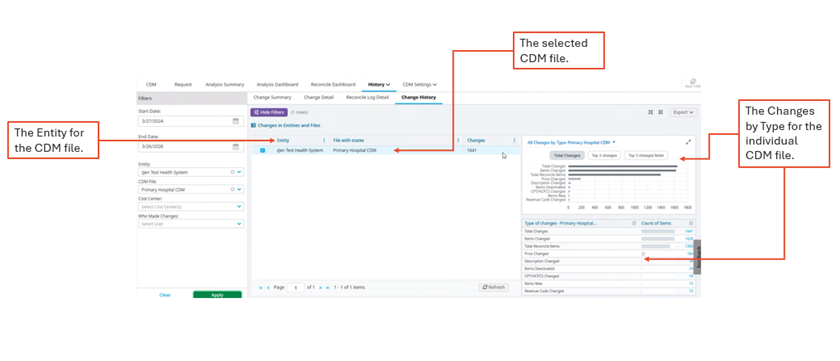 An example of the Results table when you filter to view the changes for an individual CDM file on the Filters pane.
Select a CDM file to view the change history details for on the Results table
Do the following to select a CDM file to view the change history details for on the Results table:
Enter the Start Date for the date range.
Enter the End Date for the date range.
Select the Entity. The Results table on the Change History dashboard displays all the entity’s CDM files that had changes made during date range you entered.
Click the checkbox for the individual CDM file you want to only view the change history for. The Results table on the Change History dashboard displays the changes made to only the CDM file you selected the checkbox for during the date range you entered.
Note
You can only click the checkbox for one CDM file at a time on the Results table.
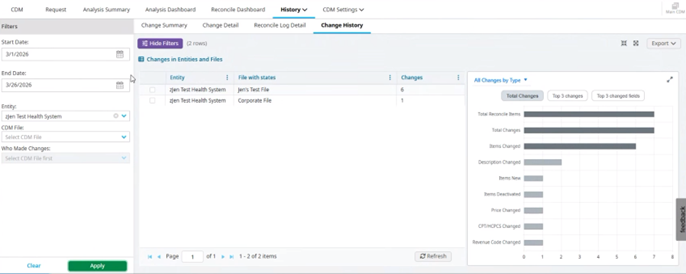
The Results table before you select the checkbox of an individual CDM file to view the change history for.
The Results table after you select the checkbox of an individual CDM file to view the change history for.
Change history visuals
The Change History dashboard breaks down the type of changes and volume of changes for an entity or individual CDM file within the All Changes by Type graph and Types of Changes/Count of Items table.
All changes by type graph
The All Changes by Type graph breaks down the changes made across the CDM files within an entity. The Change History dashboard displays the All Changes by Type graph for an entity when:
You access the Change History dashboard and view the change history details for the entity your user is built in by default.
You manually select an entity to view the change history details for on the Filters pane.
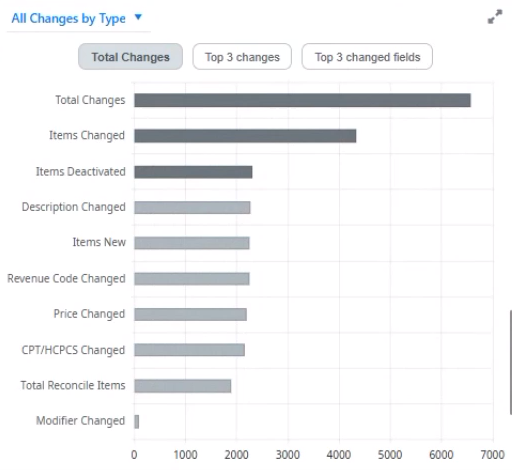
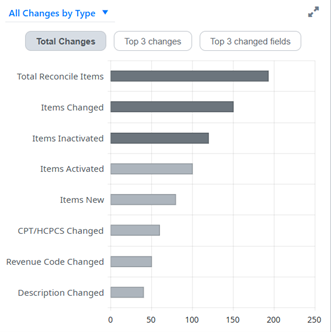
The All Changes by Type graph for an entity.
The All Changes by Type graph also breaks down the changes for an individual CDM file. The Change History dashboard displays the All Changes by Type visual for an individual CDM file when you:
Select a CDM file on the Filters pane to view the change history details for.
Select the checkbox to view the change history details for an individual CDM file on the Results table.
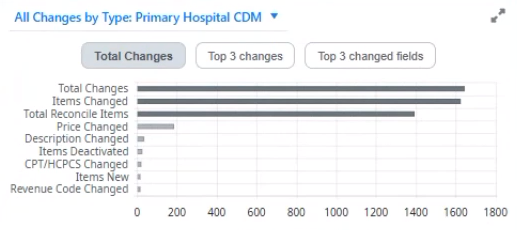
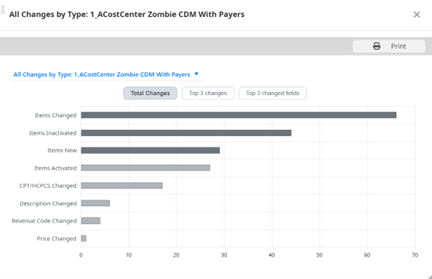
The All Changes by Type graph for an individual CDM file
You have the option to expand the All Changes by Type visual when you’re viewing it for an entity or an individual CDM file by clicking the expand icon in the top right corner.
Filter the All Changes by Type graph
The following is featured on the All Changes by Type graph when viewing the change history details for an entity or an individual CDM file:
| Field | Description |
|---|---|
| Total Changes | Click to view the total changes across CDM files for within an entity or for an individual CDM file.
Example for an entity. 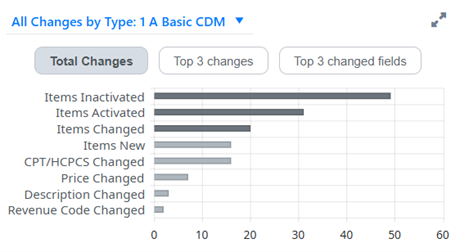
Example for an individual CDM file. |
| Top 3 Changes | Click to view the top three changes across CDM files within an entity or for an individual CDM file.
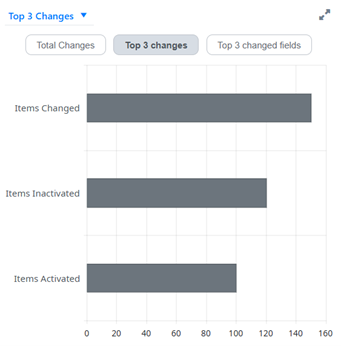
Example for an entity. 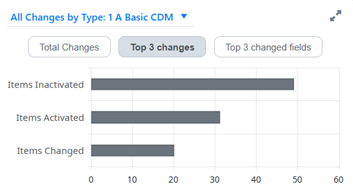
Example for an individual CDM file. |
| Top 3 Changed fields | Click to view the top three changed fields across CDM files or for an individual CDM file.
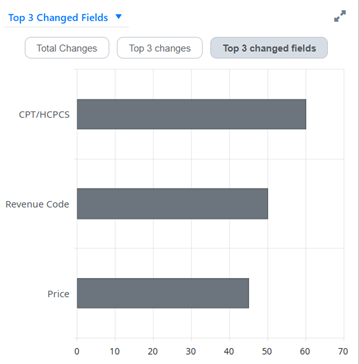
Example for an entity. 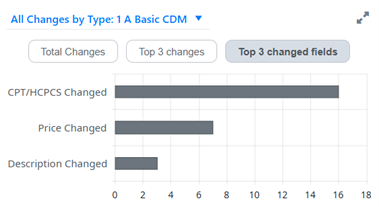
Example for an individual CDM file. |
Types of changes/Count of Items table
The Types of changes/Count of Items table displays the data from the All Changes by Type graph within a table. This table only displays when viewing the change history details for an individual CDM file.
The Type of changes – [CDM file name] column features the types of changes made to the CDM file, and the Count of Items column features the number of items within the CDM file that have a specific type of change.

Link to the Change Detail report
Do the following to view further details for a specific type of change featured in an individual CDM file within the Change Detail report:
Select an individual CDM file to view the change history details for.
Click the link in the Count of Items column on the Types of changes/Count of Items table for the type of change you want to view the Change Detail report for. The Change Detail report opens, and it’s pre-filtered to the filters you selected for the individual CDM file within the Change History dashboard.
Print a PDF of the All Changes by Type graph
Do the following to print a PDF of the All Changes by Type graph:
Select an entity or individual CDM file to view the change history details for.
Click the expand icon in the top right corner to expand the All Changes by Type graph.
Filter the All Changes by Type graph by selecting the Total Changes, Top 3 Changes, or Top 3 Changed Fields button.
Click the Print button.